The basics#
Introduction#
Python gives powerful tools for data analysis - among the main ones we find Polars, which gives fast and flexible data structures, especially for interactive data analysis.
Let’s start off by importing it:
import polars as pl
A dataframe?#
A dataframe is basically a table, that is a collection of columns, also called Series, which all contain the same number of cells – meaning they’re all of the same height. Generally, each row can be thought of as corresponding to one unit of study (one measurement, one individual, one geographical area, you name it), while each column corresponds to a specific attribute, or variable (name, size, age, description, creation date…).
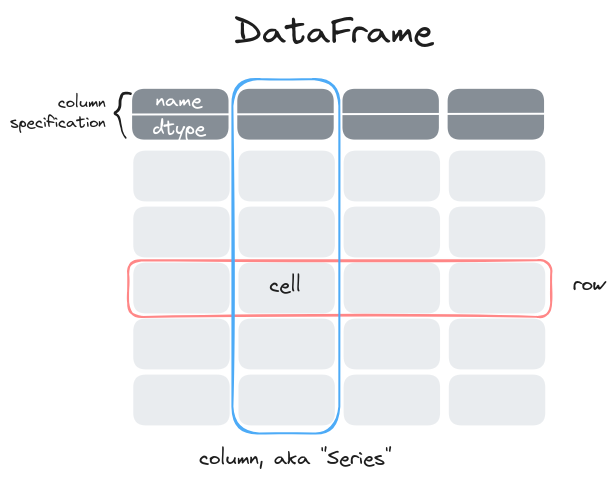
In Polars, each column has a specific type (integer, string, date, but also list or dictionary!), similarly to NumPy arrays. And, similarly to NumPy arrays, they can take “null” values in certain rows, to represent an absence of data.
But how to create one in practice? Let’s start with a simple example. The concept of a DataFrame is materialised in Polars in the DataFrame class, which we can instantiate (create) simply as follows:
pl.DataFrame()
Not much to be seen here, because we didn’t pass it any data!
Question
Before running the cells below, try to guess what their output will look like. What are the column names? The values in each row?
Let’s add some data in the form of a dictionary of lists:
df = pl.DataFrame(
    {
        "name": ["Alice", "Bob"],
        "age": [78, None],
    },
    orient="col",
)
df
Show code cell output
| name | age |
|---|---|
| str | i64 |
| "Alice" | 78 |
| "Bob" | null |
Or, equivalently, with a list of dictionaries:
df = pl.DataFrame(
    [
        {"name": "Alice", "age": 78},
        {"name": "Bob"},
    ],
    orient="row",
)
df
Show code cell output
| name | age |
|---|---|
| str | i64 |
| "Alice" | 78 |
| "Bob" | null |
Question
In the second case, adding the null entry to the output enables Polars to comply with an important property of dataframes. Which one?
Answer
That columns – or, equivalently, the rows – should all have the same number of cells!
Ingesting data#
In most cases, you actually want to deal with an existing dataset, that you’d like to analyse.
For this course, let’s try analyzing data recording protests from around the globe, collected as part of the Mass Mobilization project. No need to download anything, the data are already in the repository in the form of a CSV file. So let’s read our data, using pl.read_csv:
protests = pl.read_csv("data/protests.csv")
protests
| id | country | ccode | year | region | protest | protestnumber | startday | startmonth | startyear | endday | endmonth | endyear | protesterviolence | location | participants_category | participants | protesteridentity | protesterdemand1 | protesterdemand2 | protesterdemand3 | protesterdemand4 | stateresponse1 | stateresponse2 | stateresponse3 | stateresponse4 | stateresponse5 | stateresponse6 | stateresponse7 | sources |
|---|---|---|---|---|---|---|---|---|---|---|---|---|---|---|---|---|---|---|---|---|---|---|---|---|---|---|---|---|---|
| i64 | str | i64 | i64 | str | i64 | i64 | i64 | i64 | i64 | i64 | i64 | i64 | i64 | str | str | str | str | str | str | str | str | str | str | str | str | str | str | str | str |
| 201990001 | "Canada" | 20 | 1990 | "North America" | 1 | 1 | 15 | 1 | 1990 | 15 | 1 | 1990 | 0 | "national" | null | "1000s" | "unspecified" | "political behavior, process" | "labor wage dispute" | null | null | "ignore" | null | null | null | null | null | null | "1. great canadian train journe… |
| 201990002 | "Canada" | 20 | 1990 | "North America" | 1 | 2 | 25 | 6 | 1990 | 25 | 6 | 1990 | 0 | "Montreal, Quebec" | null | "1000" | "unspecified" | "political behavior, process" | null | null | null | "ignore" | null | null | null | null | null | null | "1. autonomy s cry revived in q… |
| 201990003 | "Canada" | 20 | 1990 | "North America" | 1 | 3 | 1 | 7 | 1990 | 1 | 7 | 1990 | 0 | "Montreal, Quebec" | null | "500" | "separatist parti quebecois" | "political behavior, process" | null | null | null | "ignore" | null | null | null | null | null | null | "1. quebec protest after queen … |
| 201990004 | "Canada" | 20 | 1990 | "North America" | 1 | 4 | 12 | 7 | 1990 | 6 | 9 | 1990 | 1 | "Montreal, Quebec" | null | "100s" | "mohawk indians" | "land farm issue" | null | null | null | "accomodation" | null | null | null | null | null | null | "1. indians gather as siege int… |
| 201990005 | "Canada" | 20 | 1990 | "North America" | 1 | 5 | 14 | 8 | 1990 | 15 | 8 | 1990 | 1 | "Montreal, Quebec" | null | "950" | "local residents" | "political behavior, process" | null | null | null | "crowd dispersal" | "arrests" | "accomodation" | null | null | null | null | "1. dozens hurt in mohawk block… |
| … | … | … | … | … | … | … | … | … | … | … | … | … | … | … | … | … | … | … | … | … | … | … | … | … | … | … | … | … | … |
| 9102017002 | "Papua New Guinea" | 910 | 2017 | "Oceania" | 1 | 2 | 15 | 7 | 2017 | 15 | 7 | 2017 | 1 | "Mount Hagen" | "50-99" | "50+" | "protesters opposed to counting… | "political behavior, process" | null | null | null | "crowd dispersal" | null | null | null | null | null | null | "violence, chaos and fraud: fra… |
| 9102017003 | "Papua New Guinea" | 910 | 2017 | "Oceania" | 1 | 3 | 31 | 10 | 2017 | 31 | 10 | 2017 | 0 | "Lorengau" | "100-999" | "About 100" | "locals" | "political behavior, process" | null | null | null | "ignore" | null | null | null | null | null | null | "refugees dig in as camp closes… |
| 9102018000 | "Papua New Guinea" | 910 | 2018 | "Oceania" | 0 | 0 | null | null | null | null | null | null | null | null | null | null | null | null | null | null | null | null | null | null | null | null | null | null | null |
| 9102019000 | "Papua New Guinea" | 910 | 2019 | "Oceania" | 0 | 0 | null | null | null | null | null | null | null | null | null | null | null | null | null | null | "." | null | null | null | null | "." | null | null | null |
| 9102020000 | "Papua New Guinea" | 910 | 2020 | "Oceania" | 0 | 0 | null | null | null | null | null | null | null | null | null | null | null | null | null | null | null | null | null | null | null | null | null | null | null |
Here it is!
Note that here, we dealt with a simple, well-formatted file. In the wild (aka, “the Internet”), you will not always meet such well-behaved data. In that case you’ll probably need to specify one of the (many) arguments of read_csv. Inspect the function to take a quick look!
Not all data are in CSV format (and they shouldn’t, it’s a very slow-to-read and heavy file format!), so Polars provides a number of other functions to ingest data. They are all in the form pl.read_<file-format>(path). Symmetrically, to write from a DataFrame to a file, the equivalent .write_<file-format>(path) are available.

Tip
In case of doubt, choose the .parquet format to save your dataframes. It strikes a very good balance between file size and reading / writing time.
Taking a glimpse#
The one DataFrame method you will probably use the most is .head(). It allows you to see the first 5 rows of the DataFrame, which is very useful to have a quick look at its current state:
protests.head()
| id | country | ccode | year | region | protest | protestnumber | startday | startmonth | startyear | endday | endmonth | endyear | protesterviolence | location | participants_category | participants | protesteridentity | protesterdemand1 | protesterdemand2 | protesterdemand3 | protesterdemand4 | stateresponse1 | stateresponse2 | stateresponse3 | stateresponse4 | stateresponse5 | stateresponse6 | stateresponse7 | sources |
|---|---|---|---|---|---|---|---|---|---|---|---|---|---|---|---|---|---|---|---|---|---|---|---|---|---|---|---|---|---|
| i64 | str | i64 | i64 | str | i64 | i64 | i64 | i64 | i64 | i64 | i64 | i64 | i64 | str | str | str | str | str | str | str | str | str | str | str | str | str | str | str | str |
| 201990001 | "Canada" | 20 | 1990 | "North America" | 1 | 1 | 15 | 1 | 1990 | 15 | 1 | 1990 | 0 | "national" | null | "1000s" | "unspecified" | "political behavior, process" | "labor wage dispute" | null | null | "ignore" | null | null | null | null | null | null | "1. great canadian train journe… |
| 201990002 | "Canada" | 20 | 1990 | "North America" | 1 | 2 | 25 | 6 | 1990 | 25 | 6 | 1990 | 0 | "Montreal, Quebec" | null | "1000" | "unspecified" | "political behavior, process" | null | null | null | "ignore" | null | null | null | null | null | null | "1. autonomy s cry revived in q… |
| 201990003 | "Canada" | 20 | 1990 | "North America" | 1 | 3 | 1 | 7 | 1990 | 1 | 7 | 1990 | 0 | "Montreal, Quebec" | null | "500" | "separatist parti quebecois" | "political behavior, process" | null | null | null | "ignore" | null | null | null | null | null | null | "1. quebec protest after queen … |
| 201990004 | "Canada" | 20 | 1990 | "North America" | 1 | 4 | 12 | 7 | 1990 | 6 | 9 | 1990 | 1 | "Montreal, Quebec" | null | "100s" | "mohawk indians" | "land farm issue" | null | null | null | "accomodation" | null | null | null | null | null | null | "1. indians gather as siege int… |
| 201990005 | "Canada" | 20 | 1990 | "North America" | 1 | 5 | 14 | 8 | 1990 | 15 | 8 | 1990 | 1 | "Montreal, Quebec" | null | "950" | "local residents" | "political behavior, process" | null | null | null | "crowd dispersal" | "arrests" | "accomodation" | null | null | null | null | "1. dozens hurt in mohawk block… |
Note
In the rest of the course, whenever we wish to show the result of some computation, we’ll append .head() to these computations to limit the size of the output. Remember to remove it if you wish to get the full result!
Also, you can get the list of column names using the .columns attribute:
protests.columns
['id',
 'country',
 'ccode',
 'year',
 'region',
 'protest',
 'protestnumber',
 'startday',
 'startmonth',
 'startyear',
 'endday',
 'endmonth',
 'endyear',
 'protesterviolence',
 'location',
 'participants_category',
 'participants',
 'protesteridentity',
 'protesterdemand1',
 'protesterdemand2',
 'protesterdemand3',
 'protesterdemand4',
 'stateresponse1',
 'stateresponse2',
 'stateresponse3',
 'stateresponse4',
 'stateresponse5',
 'stateresponse6',
 'stateresponse7',
 'sources']
And the shape of the frame (number of rows and columns) using .shape:
protests.shape
(17145, 30)
Finally, you can take a quick glimpse at it, featuring the two pieces of info we got above, plus the data types and a few values, with .glimpse():
protests.glimpse()
Rows: 17145
Columns: 30
$ id                    <i64> 201990001, 201990002, 201990003, 201990004, 201990005, 201990006, 201991001, 201991002, 201992001, 201993001
$ country               <str> 'Canada', 'Canada', 'Canada', 'Canada', 'Canada', 'Canada', 'Canada', 'Canada', 'Canada', 'Canada'
$ ccode                 <i64> 20, 20, 20, 20, 20, 20, 20, 20, 20, 20
$ year                  <i64> 1990, 1990, 1990, 1990, 1990, 1990, 1991, 1991, 1992, 1993
$ region                <str> 'North America', 'North America', 'North America', 'North America', 'North America', 'North America', 'North America', 'North America', 'North America', 'North America'
$ protest               <i64> 1, 1, 1, 1, 1, 1, 1, 1, 1, 1
$ protestnumber         <i64> 1, 2, 3, 4, 5, 6, 1, 2, 1, 1
$ startday              <i64> 15, 25, 1, 12, 14, 19, 10, 28, 4, 16
$ startmonth            <i64> 1, 6, 7, 7, 8, 9, 9, 9, 5, 5
$ startyear             <i64> 1990, 1990, 1990, 1990, 1990, 1990, 1991, 1991, 1992, 1993
$ endday                <i64> 15, 25, 1, 6, 15, 19, 17, 2, 5, 16
$ endmonth              <i64> 1, 6, 7, 9, 8, 9, 9, 10, 5, 5
$ endyear               <i64> 1990, 1990, 1990, 1990, 1990, 1990, 1991, 1991, 1992, 1993
$ protesterviolence     <i64> 0, 0, 0, 1, 1, 0, 0, 0, 1, 0
$ location              <str> 'national', 'Montreal, Quebec', 'Montreal, Quebec', 'Montreal, Quebec', 'Montreal, Quebec', 'Kahnawake Reservation near Montreal, Quebec', 'national', 'national', 'Toronto', 'Ottawa'
$ participants_category <str> None, None, None, None, None, None, None, None, None, None
$ participants          <str> '1000s', '1000', '500', '100s', '950', '200', '110000', '110000', '1000', '10000s'
$ protesteridentity     <str> 'unspecified', 'unspecified', 'separatist parti quebecois', 'mohawk indians', 'local residents', 'mohawk indians', 'public service alliance of canada', 'public service alliance of canada', 'gangs of black and white youths', 'unspecified'
$ protesterdemand1      <str> 'political behavior, process', 'political behavior, process', 'political behavior, process', 'land farm issue', 'political behavior, process', 'police brutality', 'labor wage dispute', 'labor wage dispute', 'police brutality', 'political behavior, process'
$ protesterdemand2      <str> 'labor wage dispute', None, None, None, None, None, None, None, None, None
$ protesterdemand3      <str> None, None, None, None, None, None, None, None, None, None
$ protesterdemand4      <str> None, None, None, None, None, None, None, None, None, None
$ stateresponse1        <str> 'ignore', 'ignore', 'ignore', 'accomodation', 'crowd dispersal', 'crowd dispersal', 'ignore', 'ignore', 'arrests', 'ignore'
$ stateresponse2        <str> None, None, None, None, 'arrests', 'shootings', None, None, None, None
$ stateresponse3        <str> None, None, None, None, 'accomodation', None, None, None, None, None
$ stateresponse4        <str> None, None, None, None, None, None, None, None, None, None
$ stateresponse5        <str> None, None, None, None, None, None, None, None, None, None
$ stateresponse6        <str> None, None, None, None, None, None, None, None, None, None
$ stateresponse7        <str> None, None, None, None, None, None, None, None, None, None
$ sources               <str> '1. great canadian train journeys into history; passenger rail system cut the times london , january 16 1990, tuesday, issue 63604., 427 words, from john best, ottawa;', '1. autonomy s cry revived in quebec the new york times, june 25, 1990, monday, late edition final, section a; page 3, column 4; foreign desk, 1014 words, by alessandra stanley, special to the new york times;', '1. quebec protest after queen calls for unity the times, july 2, 1990, monday, overseas news, 703 words, from john best in ottawa 2. in canada, royal rejection ; quebecois protesters turn out for queen elizabeth s visit the washington post, july 2, 1990, monday, final edition, style; page b1, 633 words, william claiborne, washington post foreign service;', '1. indians gather as siege intensifies; armed confrontation in canada reflects growing militancy the washington post, july 19, 1990, thursday, final edition, first section; page a25, 1330 words, william claiborne, washington post foreign service 2. canada to acquire site of mohawk land dispute the washington post, july 20, 1990, friday, final edition, first section; page a13, 824 words, william claiborne, washington post foreign service 3. mohawks, army still at standoff; bridge to montreal reopens to traffic the washington post, september 7, 1990, friday, final edition, first section; page a17, 1199 words, william claiborne, washington post foreign service;', '1. dozens hurt in mohawk blockade protest the times, august 14, 1990, tuesday, overseas news, 254 words, from john best in ottawa 2. canadians clash with police near a mohawk reservation the new york times, august 15, 1990, wednesday, late edition final, section a; page 16, column 6; foreign desk, 165 words, reuters;', '1. mohawks tear gassed in clash the washington post, september 19, 1990, wednesday, final edition, first section; page a17, 172 words, washington post foreign service;', '1. mulroney acts to crush strike by federal workers the new york times, september 17, 1991, tuesday, late edition final, section a; page 6; column 4; foreign desk, 761 words, by clyde h. farnsworth, special to the new york times 2. canadian strike to end but talks to go on the new york times, september 18, 1991, wednesday, late edition final, section a; page 9; column 2; foreign desk, 188 words, ap;', '1. the washington post, canada seeks to compel end of nationwide federal strike, william claiborne, washington post foreign service, october 1, 1991, tuesday, final edition, first section; page a15, 342 words;', '1. window smashing and looting spree erupts in toronto the new york times, may 5, 1992, tuesday, late edition final, section a; page 3; column 1; foreign desk 2. toronto rioters pelt police the times, may 6, 1992, wednesday, overseas news, 243 words, from john best in ottawa 3. the washington post, toronto debates causes of 2 days of violence; normally peaceful city shaken by gangs, william claiborne, washington post foreign service, may 7, 1992, thursday, final edition, first section; page a27, 685 word;', '1. canadians protest trade pact the new york times, may 16, 1993, sunday, late edition final, section 1; page 7; column 1; foreign desk, 50 words, reuters;'
Operations on columns#
Let’s see now how to select, add and transform columns.
Selecting columns#
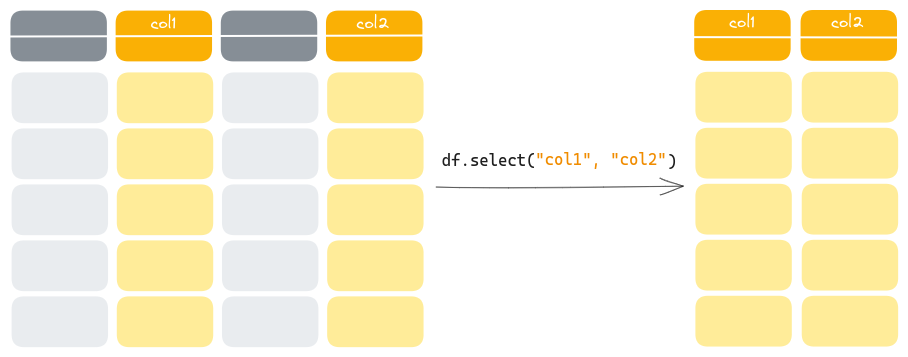
If we want a subset of columns, we pass the name of each column to .select():
protests.select('id', 'country', 'year').head()
| id | country | year |
|---|---|---|
| i64 | str | i64 |
| 201990001 | "Canada" | 1990 |
| 201990002 | "Canada" | 1990 |
| 201990003 | "Canada" | 1990 |
| 201990004 | "Canada" | 1990 |
| 201990005 | "Canada" | 1990 |
Note
This does not change the original DataFrame, to save your selection, you need to assign to a new variable!
Selecting and modifying#
Selecting columns is nice, but once they are selected, we will certainly want to do something with them, right? Like, how can we modify the values in them?
But before going into that, let’s see a slightly different way of selecting columns. The previous code is actually equivalent to:
protests.select(pl.col("id", "country", "year")).head()
| id | country | year |
|---|---|---|
| i64 | str | i64 |
| 201990001 | "Canada" | 1990 |
| 201990002 | "Canada" | 1990 |
| 201990003 | "Canada" | 1990 |
| 201990004 | "Canada" | 1990 |
| 201990005 | "Canada" | 1990 |
But why bother calling pl.col() here, and what does it even do? To answer these questions, for now let’s go back to our data and the glimpse we had above. See the protesterviolence column, that, as far as we can see, is only filled with zeros and ones? Would be nice to check if it’s actually the case, because if it is, each value in this column can probably be treated as a boolean telling us whether part of the protesters used violence.
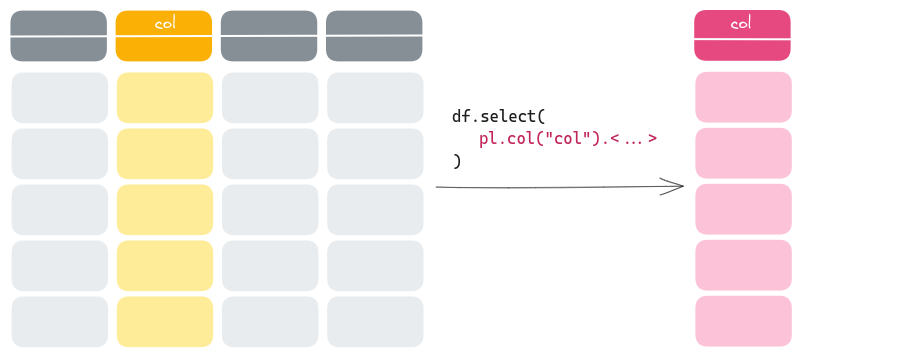
Well this can simply be done by selecting the column with pl.col(), and then calling the .unique() method on it, as follows:
protests.select(pl.col("protesterviolence").unique())
| protesterviolence |
|---|
| i64 |
| null |
| 0 |
| 1 |
Calling pl.col() therefore enabled us to perform an operation on the selected column! And about the latter, it indeed turns out we only have zeros and ones in there, save some nulls that denote an absence of data.
Note
Putting zeros and ones to encode a boolean is actually a pretty common practice, you might come across this again!
Note
It is usually better to start reading any documentation you can find about the dataset before making tests like these. In some situations though, there is no documentation, so you have to make this kind of tests to validate your assumptions.
We can subsequently safely transform this integer column into a boolean one, using the .cast() method, and (optionally) renaming it using .alias():
protests.select(pl.col("protesterviolence").cast(bool).alias("There was protester violence")).head()
| There was protester violence |
|---|
| bool |
| false |
| false |
| false |
| true |
| true |
Question
Why does the following code have absolutely no chance of producing the desired behaviour?
protests.select("protesterviolence".cast(bool))
Answer
Because "protesterviolence" is a string, and the cast method is not defined on strings. And even if it was, this string object does not hold the data inside the column, it is just a string, so no string method could ever transform the data inside the column! That’s why this pl.col() abstraction exists: its methods allows us to access column data from the DataFrame under consideration.
So, to wrap this up, the pl.col() function of Polars is absolutely central: it creates an Expression, allowing you to call one of its many methods to perform computations on the selected column.
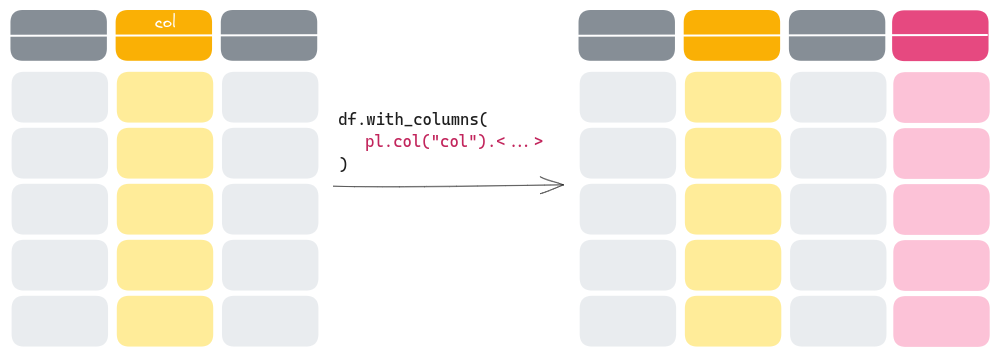
Adding columns#
To keep existing columns and add new ones, the .with_columns() method will come in handy.
Let’s first see how to add a new column using data from outside the dataframe:
protests.with_columns(
    from_scalar=pl.lit("a"),
    from_series=pl.Series(list(range(protests.shape[0]))),
).head()
| id | country | ccode | year | region | protest | protestnumber | startday | startmonth | startyear | endday | endmonth | endyear | protesterviolence | location | participants_category | participants | protesteridentity | protesterdemand1 | protesterdemand2 | protesterdemand3 | protesterdemand4 | stateresponse1 | stateresponse2 | stateresponse3 | stateresponse4 | stateresponse5 | stateresponse6 | stateresponse7 | sources | from_scalar | from_series |
|---|---|---|---|---|---|---|---|---|---|---|---|---|---|---|---|---|---|---|---|---|---|---|---|---|---|---|---|---|---|---|---|
| i64 | str | i64 | i64 | str | i64 | i64 | i64 | i64 | i64 | i64 | i64 | i64 | i64 | str | str | str | str | str | str | str | str | str | str | str | str | str | str | str | str | str | i64 |
| 201990001 | "Canada" | 20 | 1990 | "North America" | 1 | 1 | 15 | 1 | 1990 | 15 | 1 | 1990 | 0 | "national" | null | "1000s" | "unspecified" | "political behavior, process" | "labor wage dispute" | null | null | "ignore" | null | null | null | null | null | null | "1. great canadian train journe… | "a" | 0 |
| 201990002 | "Canada" | 20 | 1990 | "North America" | 1 | 2 | 25 | 6 | 1990 | 25 | 6 | 1990 | 0 | "Montreal, Quebec" | null | "1000" | "unspecified" | "political behavior, process" | null | null | null | "ignore" | null | null | null | null | null | null | "1. autonomy s cry revived in q… | "a" | 1 |
| 201990003 | "Canada" | 20 | 1990 | "North America" | 1 | 3 | 1 | 7 | 1990 | 1 | 7 | 1990 | 0 | "Montreal, Quebec" | null | "500" | "separatist parti quebecois" | "political behavior, process" | null | null | null | "ignore" | null | null | null | null | null | null | "1. quebec protest after queen … | "a" | 2 |
| 201990004 | "Canada" | 20 | 1990 | "North America" | 1 | 4 | 12 | 7 | 1990 | 6 | 9 | 1990 | 1 | "Montreal, Quebec" | null | "100s" | "mohawk indians" | "land farm issue" | null | null | null | "accomodation" | null | null | null | null | null | null | "1. indians gather as siege int… | "a" | 3 |
| 201990005 | "Canada" | 20 | 1990 | "North America" | 1 | 5 | 14 | 8 | 1990 | 15 | 8 | 1990 | 1 | "Montreal, Quebec" | null | "950" | "local residents" | "political behavior, process" | null | null | null | "crowd dispersal" | "arrests" | "accomodation" | null | null | null | null | "1. dozens hurt in mohawk block… | "a" | 4 |
We’ve covered two cases here:
when you’d like to have a column filled with the same value, you will need to specify you’re providing the literal value you want in each row with
pl.lit(),when you want to provide directly all the distinct values to be put in rows, you will need
pl.Series().
Now, let’s see how to add columns using the values from existing ones. We’ll try to get the duration in days of all the protests in our dataset. To that end, let’s first find out what columns could help us here:
protests.head()
| id | country | ccode | year | region | protest | protestnumber | startday | startmonth | startyear | endday | endmonth | endyear | protesterviolence | location | participants_category | participants | protesteridentity | protesterdemand1 | protesterdemand2 | protesterdemand3 | protesterdemand4 | stateresponse1 | stateresponse2 | stateresponse3 | stateresponse4 | stateresponse5 | stateresponse6 | stateresponse7 | sources |
|---|---|---|---|---|---|---|---|---|---|---|---|---|---|---|---|---|---|---|---|---|---|---|---|---|---|---|---|---|---|
| i64 | str | i64 | i64 | str | i64 | i64 | i64 | i64 | i64 | i64 | i64 | i64 | i64 | str | str | str | str | str | str | str | str | str | str | str | str | str | str | str | str |
| 201990001 | "Canada" | 20 | 1990 | "North America" | 1 | 1 | 15 | 1 | 1990 | 15 | 1 | 1990 | 0 | "national" | null | "1000s" | "unspecified" | "political behavior, process" | "labor wage dispute" | null | null | "ignore" | null | null | null | null | null | null | "1. great canadian train journe… |
| 201990002 | "Canada" | 20 | 1990 | "North America" | 1 | 2 | 25 | 6 | 1990 | 25 | 6 | 1990 | 0 | "Montreal, Quebec" | null | "1000" | "unspecified" | "political behavior, process" | null | null | null | "ignore" | null | null | null | null | null | null | "1. autonomy s cry revived in q… |
| 201990003 | "Canada" | 20 | 1990 | "North America" | 1 | 3 | 1 | 7 | 1990 | 1 | 7 | 1990 | 0 | "Montreal, Quebec" | null | "500" | "separatist parti quebecois" | "political behavior, process" | null | null | null | "ignore" | null | null | null | null | null | null | "1. quebec protest after queen … |
| 201990004 | "Canada" | 20 | 1990 | "North America" | 1 | 4 | 12 | 7 | 1990 | 6 | 9 | 1990 | 1 | "Montreal, Quebec" | null | "100s" | "mohawk indians" | "land farm issue" | null | null | null | "accomodation" | null | null | null | null | null | null | "1. indians gather as siege int… |
| 201990005 | "Canada" | 20 | 1990 | "North America" | 1 | 5 | 14 | 8 | 1990 | 15 | 8 | 1990 | 1 | "Montreal, Quebec" | null | "950" | "local residents" | "political behavior, process" | null | null | null | "crowd dispersal" | "arrests" | "accomodation" | null | null | null | null | "1. dozens hurt in mohawk block… |
It does seem that the start and end day of each protest are each encoded in 3 columns of integers, respectively: ["startyear", "startmonth", "startday"], and ["endyear", "endmonth", "endday"]. This makes it very annoying to compute the duration of protests, because, for instance, if a protest spans more than a month, we can’t just subtract "endday" with "startday", which are day numbers within their month. So let’s first compute two new columns for the start and end date, with an actual date data type, which will save us a headache. Here we’ll use the pl.date() function:
protests = protests.with_columns(
    pl.date("startyear", "startmonth", "startday").alias("start_date"),
    pl.date("endyear", "endmonth", "endday").alias("end_date"),
)
protests.head()
| id | country | ccode | year | region | protest | protestnumber | startday | startmonth | startyear | endday | endmonth | endyear | protesterviolence | location | participants_category | participants | protesteridentity | protesterdemand1 | protesterdemand2 | protesterdemand3 | protesterdemand4 | stateresponse1 | stateresponse2 | stateresponse3 | stateresponse4 | stateresponse5 | stateresponse6 | stateresponse7 | sources | start_date | end_date |
|---|---|---|---|---|---|---|---|---|---|---|---|---|---|---|---|---|---|---|---|---|---|---|---|---|---|---|---|---|---|---|---|
| i64 | str | i64 | i64 | str | i64 | i64 | i64 | i64 | i64 | i64 | i64 | i64 | i64 | str | str | str | str | str | str | str | str | str | str | str | str | str | str | str | str | date | date |
| 201990001 | "Canada" | 20 | 1990 | "North America" | 1 | 1 | 15 | 1 | 1990 | 15 | 1 | 1990 | 0 | "national" | null | "1000s" | "unspecified" | "political behavior, process" | "labor wage dispute" | null | null | "ignore" | null | null | null | null | null | null | "1. great canadian train journe… | 1990-01-15 | 1990-01-15 |
| 201990002 | "Canada" | 20 | 1990 | "North America" | 1 | 2 | 25 | 6 | 1990 | 25 | 6 | 1990 | 0 | "Montreal, Quebec" | null | "1000" | "unspecified" | "political behavior, process" | null | null | null | "ignore" | null | null | null | null | null | null | "1. autonomy s cry revived in q… | 1990-06-25 | 1990-06-25 |
| 201990003 | "Canada" | 20 | 1990 | "North America" | 1 | 3 | 1 | 7 | 1990 | 1 | 7 | 1990 | 0 | "Montreal, Quebec" | null | "500" | "separatist parti quebecois" | "political behavior, process" | null | null | null | "ignore" | null | null | null | null | null | null | "1. quebec protest after queen … | 1990-07-01 | 1990-07-01 |
| 201990004 | "Canada" | 20 | 1990 | "North America" | 1 | 4 | 12 | 7 | 1990 | 6 | 9 | 1990 | 1 | "Montreal, Quebec" | null | "100s" | "mohawk indians" | "land farm issue" | null | null | null | "accomodation" | null | null | null | null | null | null | "1. indians gather as siege int… | 1990-07-12 | 1990-09-06 |
| 201990005 | "Canada" | 20 | 1990 | "North America" | 1 | 5 | 14 | 8 | 1990 | 15 | 8 | 1990 | 1 | "Montreal, Quebec" | null | "950" | "local residents" | "political behavior, process" | null | null | null | "crowd dispersal" | "arrests" | "accomodation" | null | null | null | null | "1. dozens hurt in mohawk block… | 1990-08-14 | 1990-08-15 |
And now we just have to subtract "start_date" from "end_date" to get our duration! There is one small problem though. As you can see from the result above, when a protest occurred over one day, the start_date and end_date are identical. There is a simple solution to that: we can add a duration of one day to every entry by adding pl.duration(days=1). That works exactly like adding a scalar to a NumPy array: the value is added to each element.
protests = protests.with_columns(
    duration=pl.col("end_date") - pl.col("start_date") + pl.duration(days=1)
)
protests.head()
| id | country | ccode | year | region | protest | protestnumber | startday | startmonth | startyear | endday | endmonth | endyear | protesterviolence | location | participants_category | participants | protesteridentity | protesterdemand1 | protesterdemand2 | protesterdemand3 | protesterdemand4 | stateresponse1 | stateresponse2 | stateresponse3 | stateresponse4 | stateresponse5 | stateresponse6 | stateresponse7 | sources | start_date | end_date | duration |
|---|---|---|---|---|---|---|---|---|---|---|---|---|---|---|---|---|---|---|---|---|---|---|---|---|---|---|---|---|---|---|---|---|
| i64 | str | i64 | i64 | str | i64 | i64 | i64 | i64 | i64 | i64 | i64 | i64 | i64 | str | str | str | str | str | str | str | str | str | str | str | str | str | str | str | str | date | date | duration[ms] |
| 201990001 | "Canada" | 20 | 1990 | "North America" | 1 | 1 | 15 | 1 | 1990 | 15 | 1 | 1990 | 0 | "national" | null | "1000s" | "unspecified" | "political behavior, process" | "labor wage dispute" | null | null | "ignore" | null | null | null | null | null | null | "1. great canadian train journe… | 1990-01-15 | 1990-01-15 | 1d |
| 201990002 | "Canada" | 20 | 1990 | "North America" | 1 | 2 | 25 | 6 | 1990 | 25 | 6 | 1990 | 0 | "Montreal, Quebec" | null | "1000" | "unspecified" | "political behavior, process" | null | null | null | "ignore" | null | null | null | null | null | null | "1. autonomy s cry revived in q… | 1990-06-25 | 1990-06-25 | 1d |
| 201990003 | "Canada" | 20 | 1990 | "North America" | 1 | 3 | 1 | 7 | 1990 | 1 | 7 | 1990 | 0 | "Montreal, Quebec" | null | "500" | "separatist parti quebecois" | "political behavior, process" | null | null | null | "ignore" | null | null | null | null | null | null | "1. quebec protest after queen … | 1990-07-01 | 1990-07-01 | 1d |
| 201990004 | "Canada" | 20 | 1990 | "North America" | 1 | 4 | 12 | 7 | 1990 | 6 | 9 | 1990 | 1 | "Montreal, Quebec" | null | "100s" | "mohawk indians" | "land farm issue" | null | null | null | "accomodation" | null | null | null | null | null | null | "1. indians gather as siege int… | 1990-07-12 | 1990-09-06 | 57d |
| 201990005 | "Canada" | 20 | 1990 | "North America" | 1 | 5 | 14 | 8 | 1990 | 15 | 8 | 1990 | 1 | "Montreal, Quebec" | null | "950" | "local residents" | "political behavior, process" | null | null | null | "crowd dispersal" | "arrests" | "accomodation" | null | null | null | null | "1. dozens hurt in mohawk block… | 1990-08-14 | 1990-08-15 | 2d |
Note
Here we gave our column a name through the name of the keyword argument passed to with_columns. This is just another way to .alias().
Exercise: years of protest#
In the protests dataframe, create the two following integer columns:
nr_years_calendarindicating how many different calendar years each protest spanned,nr_yearsindicating how many (actual) years the protest lasted
protests.select(pl.col('duration'))
| duration |
|---|
| duration[ms] |
| 1d |
| 1d |
| 1d |
| 57d |
| 2d |
| … |
| 1d |
| 1d |
| null |
| null |
| null |
Show code cell source
protests.with_columns(
    nr_years_calendar=pl.col('endyear') - pl.col('startyear') + 1,
    nr_years=pl.col('duration').dt.total_days() // 365,
).head()
| id | country | ccode | year | region | protest | protestnumber | startday | startmonth | startyear | endday | endmonth | endyear | protesterviolence | location | participants_category | participants | protesteridentity | protesterdemand1 | protesterdemand2 | protesterdemand3 | protesterdemand4 | stateresponse1 | stateresponse2 | stateresponse3 | stateresponse4 | stateresponse5 | stateresponse6 | stateresponse7 | sources | start_date | end_date | duration | nr_years_calendar | nr_years |
|---|---|---|---|---|---|---|---|---|---|---|---|---|---|---|---|---|---|---|---|---|---|---|---|---|---|---|---|---|---|---|---|---|---|---|
| i64 | str | i64 | i64 | str | i64 | i64 | i64 | i64 | i64 | i64 | i64 | i64 | i64 | str | str | str | str | str | str | str | str | str | str | str | str | str | str | str | str | date | date | duration[ms] | i64 | i64 |
| 201990001 | "Canada" | 20 | 1990 | "North America" | 1 | 1 | 15 | 1 | 1990 | 15 | 1 | 1990 | 0 | "national" | null | "1000s" | "unspecified" | "political behavior, process" | "labor wage dispute" | null | null | "ignore" | null | null | null | null | null | null | "1. great canadian train journe… | 1990-01-15 | 1990-01-15 | 1d | 1 | 0 |
| 201990002 | "Canada" | 20 | 1990 | "North America" | 1 | 2 | 25 | 6 | 1990 | 25 | 6 | 1990 | 0 | "Montreal, Quebec" | null | "1000" | "unspecified" | "political behavior, process" | null | null | null | "ignore" | null | null | null | null | null | null | "1. autonomy s cry revived in q… | 1990-06-25 | 1990-06-25 | 1d | 1 | 0 |
| 201990003 | "Canada" | 20 | 1990 | "North America" | 1 | 3 | 1 | 7 | 1990 | 1 | 7 | 1990 | 0 | "Montreal, Quebec" | null | "500" | "separatist parti quebecois" | "political behavior, process" | null | null | null | "ignore" | null | null | null | null | null | null | "1. quebec protest after queen … | 1990-07-01 | 1990-07-01 | 1d | 1 | 0 |
| 201990004 | "Canada" | 20 | 1990 | "North America" | 1 | 4 | 12 | 7 | 1990 | 6 | 9 | 1990 | 1 | "Montreal, Quebec" | null | "100s" | "mohawk indians" | "land farm issue" | null | null | null | "accomodation" | null | null | null | null | null | null | "1. indians gather as siege int… | 1990-07-12 | 1990-09-06 | 57d | 1 | 0 |
| 201990005 | "Canada" | 20 | 1990 | "North America" | 1 | 5 | 14 | 8 | 1990 | 15 | 8 | 1990 | 1 | "Montreal, Quebec" | null | "950" | "local residents" | "political behavior, process" | null | null | null | "crowd dispersal" | "arrests" | "accomodation" | null | null | null | null | "1. dozens hurt in mohawk block… | 1990-08-14 | 1990-08-15 | 2d | 1 | 0 |
Hint
The second one is tricky: take into account that the column “duration” is a Duration data type. You’ll need to head over to the documentation on temporal expressions, and search in particular for those that apply to a Duration to find a method that can help you out.
Operations on rows#
If we consider the rows of a dataset, typically we may wish to select only some of them, change their order or add some new rows.
Selecting by row numbers#
The simplest way to select only certain rows is through their corresponding number, i.e., their vertical position in the frame.
For instance, you can select the first two or the three last rows in the corresponding following ways:
protests.head(2)
| id | country | ccode | year | region | protest | protestnumber | startday | startmonth | startyear | endday | endmonth | endyear | protesterviolence | location | participants_category | participants | protesteridentity | protesterdemand1 | protesterdemand2 | protesterdemand3 | protesterdemand4 | stateresponse1 | stateresponse2 | stateresponse3 | stateresponse4 | stateresponse5 | stateresponse6 | stateresponse7 | sources | start_date | end_date | duration |
|---|---|---|---|---|---|---|---|---|---|---|---|---|---|---|---|---|---|---|---|---|---|---|---|---|---|---|---|---|---|---|---|---|
| i64 | str | i64 | i64 | str | i64 | i64 | i64 | i64 | i64 | i64 | i64 | i64 | i64 | str | str | str | str | str | str | str | str | str | str | str | str | str | str | str | str | date | date | duration[ms] |
| 201990001 | "Canada" | 20 | 1990 | "North America" | 1 | 1 | 15 | 1 | 1990 | 15 | 1 | 1990 | 0 | "national" | null | "1000s" | "unspecified" | "political behavior, process" | "labor wage dispute" | null | null | "ignore" | null | null | null | null | null | null | "1. great canadian train journe… | 1990-01-15 | 1990-01-15 | 1d |
| 201990002 | "Canada" | 20 | 1990 | "North America" | 1 | 2 | 25 | 6 | 1990 | 25 | 6 | 1990 | 0 | "Montreal, Quebec" | null | "1000" | "unspecified" | "political behavior, process" | null | null | null | "ignore" | null | null | null | null | null | null | "1. autonomy s cry revived in q… | 1990-06-25 | 1990-06-25 | 1d |
protests.tail(3)
| id | country | ccode | year | region | protest | protestnumber | startday | startmonth | startyear | endday | endmonth | endyear | protesterviolence | location | participants_category | participants | protesteridentity | protesterdemand1 | protesterdemand2 | protesterdemand3 | protesterdemand4 | stateresponse1 | stateresponse2 | stateresponse3 | stateresponse4 | stateresponse5 | stateresponse6 | stateresponse7 | sources | start_date | end_date | duration |
|---|---|---|---|---|---|---|---|---|---|---|---|---|---|---|---|---|---|---|---|---|---|---|---|---|---|---|---|---|---|---|---|---|
| i64 | str | i64 | i64 | str | i64 | i64 | i64 | i64 | i64 | i64 | i64 | i64 | i64 | str | str | str | str | str | str | str | str | str | str | str | str | str | str | str | str | date | date | duration[ms] |
| 9102018000 | "Papua New Guinea" | 910 | 2018 | "Oceania" | 0 | 0 | null | null | null | null | null | null | null | null | null | null | null | null | null | null | null | null | null | null | null | null | null | null | null | null | null | null |
| 9102019000 | "Papua New Guinea" | 910 | 2019 | "Oceania" | 0 | 0 | null | null | null | null | null | null | null | null | null | null | null | null | null | null | "." | null | null | null | null | "." | null | null | null | null | null | null |
| 9102020000 | "Papua New Guinea" | 910 | 2020 | "Oceania" | 0 | 0 | null | null | null | null | null | null | null | null | null | null | null | null | null | null | null | null | null | null | null | null | null | null | null | null | null | null |
Note
As shown earlier, if you call .head() or .tail() without any argument, they will show you 5 rows.
It’s also possible to select contiguous rows by using slicing, as we already did for strings, lists and arrays.
For example, here we select two rows starting from the fifth (included):
protests.slice(5, 2)
| id | country | ccode | year | region | protest | protestnumber | startday | startmonth | startyear | endday | endmonth | endyear | protesterviolence | location | participants_category | participants | protesteridentity | protesterdemand1 | protesterdemand2 | protesterdemand3 | protesterdemand4 | stateresponse1 | stateresponse2 | stateresponse3 | stateresponse4 | stateresponse5 | stateresponse6 | stateresponse7 | sources | start_date | end_date | duration |
|---|---|---|---|---|---|---|---|---|---|---|---|---|---|---|---|---|---|---|---|---|---|---|---|---|---|---|---|---|---|---|---|---|
| i64 | str | i64 | i64 | str | i64 | i64 | i64 | i64 | i64 | i64 | i64 | i64 | i64 | str | str | str | str | str | str | str | str | str | str | str | str | str | str | str | str | date | date | duration[ms] |
| 201990006 | "Canada" | 20 | 1990 | "North America" | 1 | 6 | 19 | 9 | 1990 | 19 | 9 | 1990 | 0 | "Kahnawake Reservation near Mon… | null | "200" | "mohawk indians" | "police brutality" | null | null | null | "crowd dispersal" | "shootings" | null | null | null | null | null | "1. mohawks tear gassed in clas… | 1990-09-19 | 1990-09-19 | 1d |
| 201991001 | "Canada" | 20 | 1991 | "North America" | 1 | 1 | 10 | 9 | 1991 | 17 | 9 | 1991 | 0 | "national" | null | "110000" | "public service alliance of can… | "labor wage dispute" | null | null | null | "ignore" | null | null | null | null | null | null | "1. mulroney acts to crush stri… | 1991-09-10 | 1991-09-17 | 8d |
Selecting rows fulfilling some conditions#
Selecting by row numbers is simple, but most of the time you do not know in which position the relevant rows are, as their relevance depends on one or more specific conditions. So let’s see now how to filter data according to a condition they should satisfy.
This can be done using the .filter() method of DataFrames. As argument, it takes an expression evaluated for each row. All rows for which the expression evaluates to True are then kept.
So, for instance, to only keep rows corresponding to protests that happened in Italy:
protests.filter(pl.col("country") == "Italy").head()
| id | country | ccode | year | region | protest | protestnumber | startday | startmonth | startyear | endday | endmonth | endyear | protesterviolence | location | participants_category | participants | protesteridentity | protesterdemand1 | protesterdemand2 | protesterdemand3 | protesterdemand4 | stateresponse1 | stateresponse2 | stateresponse3 | stateresponse4 | stateresponse5 | stateresponse6 | stateresponse7 | sources | start_date | end_date | duration |
|---|---|---|---|---|---|---|---|---|---|---|---|---|---|---|---|---|---|---|---|---|---|---|---|---|---|---|---|---|---|---|---|---|
| i64 | str | i64 | i64 | str | i64 | i64 | i64 | i64 | i64 | i64 | i64 | i64 | i64 | str | str | str | str | str | str | str | str | str | str | str | str | str | str | str | str | date | date | duration[ms] |
| 3251990001 | "Italy" | 325 | 1990 | "Europe" | 1 | 1 | 13 | 7 | 1990 | 13 | 7 | 1990 | 1 | "Sicilian town of Ribera" | "100-999" | "> 50" | "farmers" | "political behavior, process" | null | null | null | "ignore" | null | null | null | null | null | null | "sicilians riot over water shor… | 1990-07-13 | 1990-07-13 | 1d |
| 3251991001 | "Italy" | 325 | 1991 | "Europe" | 1 | 1 | 6 | 6 | 1991 | 6 | 6 | 1991 | 0 | "the Italian port of Brindisi" | "100-999" | "hundreds" | "albanians" | "political behavior, process" | null | null | null | "accomodation" | null | null | null | null | null | null | "refugees riot. the times. june… | 1991-06-06 | 1991-06-06 | 1d |
| 3251991002 | "Italy" | 325 | 1991 | "Europe" | 1 | 2 | 22 | 10 | 1991 | 22 | 10 | 1991 | 0 | "major cities" | "5000-10000" | "Thousands " | "people" | "political behavior, process" | null | null | null | "ignore" | null | null | null | null | null | null | "1. italians strike to protest … | 1991-10-22 | 1991-10-22 | 1d |
| 3251992001 | "Italy" | 325 | 1992 | "Europe" | 1 | 1 | 28 | 6 | 1992 | 28 | 6 | 1992 | 0 | "Palermo" | ">10000" | "100000" | "people" | "political behavior, process" | null | null | null | "ignore" | null | null | null | null | null | null | "1. anti mafia protest. the was… | 1992-06-28 | 1992-06-28 | 1d |
| 3251992002 | "Italy" | 325 | 1992 | "Europe" | 1 | 2 | 21 | 7 | 1992 | 21 | 7 | 1992 | 0 | "Milan, Rome,Palermo, and in ot… | ">10000" | "> 15000" | "people and police officers" | "political behavior, process" | null | null | null | "ignore" | "beatings" | null | null | null | null | null | "1. sicilians jeer italian lead… | 1992-07-21 | 1992-07-21 | 1d |
Notice here the usage of pl.col() that we’ve seen earlier! Again, this allows us to access the values contained in a column, here to make an equality test and return a boolean.
And again, as seen previously when we computed the protests’ durations, values from different columns can be compared. To illustrate that, here below we’ll select all protests that spanned more than one calendar year:
protests.filter(pl.col("startyear") != pl.col("endyear")).head()
| id | country | ccode | year | region | protest | protestnumber | startday | startmonth | startyear | endday | endmonth | endyear | protesterviolence | location | participants_category | participants | protesteridentity | protesterdemand1 | protesterdemand2 | protesterdemand3 | protesterdemand4 | stateresponse1 | stateresponse2 | stateresponse3 | stateresponse4 | stateresponse5 | stateresponse6 | stateresponse7 | sources | start_date | end_date | duration |
|---|---|---|---|---|---|---|---|---|---|---|---|---|---|---|---|---|---|---|---|---|---|---|---|---|---|---|---|---|---|---|---|---|
| i64 | str | i64 | i64 | str | i64 | i64 | i64 | i64 | i64 | i64 | i64 | i64 | i64 | str | str | str | str | str | str | str | str | str | str | str | str | str | str | str | str | date | date | duration[ms] |
| 701991004 | "Mexico" | 70 | 1991 | "North America" | 1 | 4 | 23 | 11 | 1991 | 15 | 1 | 1992 | 0 | "Tabasco to Mexico City" | null | "100s" | "democratic revolutionary party… | "political behavior, process" | null | null | null | "ignore" | null | null | null | null | null | null | "1. the washington post, mexica… | 1991-11-23 | 1992-01-15 | 54d |
| 1001994005 | "Colombia" | 100 | 1994 | "South America" | 1 | 5 | 22 | 12 | 1994 | 11 | 1 | 1995 | 0 | "southern Colombia" | null | "5000" | "putumayo peasant movement" | "political behavior, process" | null | null | null | "accomodation" | "killings" | "crowd dispersal" | null | null | null | null | "xinhua news agency, january 3,… | 1994-12-22 | 1995-01-11 | 21d |
| 1011996013 | "Venezuela" | 101 | 1996 | "South America" | 1 | 13 | 27 | 12 | 1996 | 15 | 1 | 1997 | 0 | "national level" | null | "50" | "health workers" | "labor wage dispute" | null | null | null | "ignore" | null | null | null | null | null | null | "the associated press, january … | 1996-12-27 | 1997-01-15 | 20d |
| 1012002010 | "Venezuela" | 101 | 2002 | "South America" | 1 | 10 | 3 | 12 | 2002 | 4 | 2 | 2003 | 0 | "national level" | null | "10000" | "workers" | "political behavior, process" | null | null | null | "ignore" | null | null | null | null | null | null | "the washington post, december … | 2002-12-03 | 2003-02-04 | 64d |
| 1012004016 | "Venezuela" | 101 | 2004 | "South America" | 1 | 16 | 16 | 12 | 2004 | 22 | 1 | 2005 | 0 | "national level 4 different pr… | null | "2500" | "inmates" | "political behavior, process" | null | null | null | "accomodation" | null | null | null | null | null | null | "associated press worldstream, … | 2004-12-16 | 2005-01-22 | 38d |
It’s also possible to combine conditions like we already did in Numpy filtering: for example by using the special operator conjunction & :
protests.filter(
    (pl.col("country") == "Italy")
    & (pl.col("year") == 1992)
)
| id | country | ccode | year | region | protest | protestnumber | startday | startmonth | startyear | endday | endmonth | endyear | protesterviolence | location | participants_category | participants | protesteridentity | protesterdemand1 | protesterdemand2 | protesterdemand3 | protesterdemand4 | stateresponse1 | stateresponse2 | stateresponse3 | stateresponse4 | stateresponse5 | stateresponse6 | stateresponse7 | sources | start_date | end_date | duration |
|---|---|---|---|---|---|---|---|---|---|---|---|---|---|---|---|---|---|---|---|---|---|---|---|---|---|---|---|---|---|---|---|---|
| i64 | str | i64 | i64 | str | i64 | i64 | i64 | i64 | i64 | i64 | i64 | i64 | i64 | str | str | str | str | str | str | str | str | str | str | str | str | str | str | str | str | date | date | duration[ms] |
| 3251992001 | "Italy" | 325 | 1992 | "Europe" | 1 | 1 | 28 | 6 | 1992 | 28 | 6 | 1992 | 0 | "Palermo" | ">10000" | "100000" | "people" | "political behavior, process" | null | null | null | "ignore" | null | null | null | null | null | null | "1. anti mafia protest. the was… | 1992-06-28 | 1992-06-28 | 1d |
| 3251992002 | "Italy" | 325 | 1992 | "Europe" | 1 | 2 | 21 | 7 | 1992 | 21 | 7 | 1992 | 0 | "Milan, Rome,Palermo, and in ot… | ">10000" | "> 15000" | "people and police officers" | "political behavior, process" | null | null | null | "ignore" | "beatings" | null | null | null | null | null | "1. sicilians jeer italian lead… | 1992-07-21 | 1992-07-21 | 1d |
| 3251992003 | "Italy" | 325 | 1992 | "Europe" | 1 | 3 | 3 | 10 | 1992 | 3 | 10 | 1992 | 1 | "Rome" | "100-999" | "hundreds" | "left wing italian demonstrator… | "political behavior, process" | null | null | null | "beatings" | "crowd dispersal" | null | null | null | null | null | "police attack rome rioters. th… | 1992-10-03 | 1992-10-03 | 1d |
| 3251992004 | "Italy" | 325 | 1992 | "Europe" | 1 | 4 | 13 | 10 | 1992 | 13 | 10 | 1992 | 0 | "Across Italy" | ">10000" | "millions" | "workers" | "political behavior, process" | null | null | null | "ignore" | "accomodation" | null | null | null | null | null | "1. millions in italy march in … | 1992-10-13 | 1992-10-13 | 1d |
| 3251992005 | "Italy" | 325 | 1992 | "Europe" | 1 | 5 | 26 | 10 | 1992 | 26 | 10 | 1992 | 0 | "Rome" | ">10000" | "10000" | "shopkeepers" | "political behavior, process" | null | null | null | "ignore" | null | null | null | null | null | null | "italy shopowners protest tax p… | 1992-10-26 | 1992-10-26 | 1d |
| 3251992006 | "Italy" | 325 | 1992 | "Europe" | 1 | 6 | 16 | 12 | 1992 | 16 | 12 | 1992 | 0 | "Rome" | ">10000" | "20000" | "doctors" | "political behavior, process" | null | null | null | "ignore" | null | null | null | null | null | null | "rome doctors demonstrate to pr… | 1992-12-16 | 1992-12-16 | 1d |

Sorting#
To obtain a new dataframe sorted according to one or more columns, we can use the .sort() method.
For instance, to see the longest protests, we’d do:
protests.sort(by='duration', descending=True).head()
| id | country | ccode | year | region | protest | protestnumber | startday | startmonth | startyear | endday | endmonth | endyear | protesterviolence | location | participants_category | participants | protesteridentity | protesterdemand1 | protesterdemand2 | protesterdemand3 | protesterdemand4 | stateresponse1 | stateresponse2 | stateresponse3 | stateresponse4 | stateresponse5 | stateresponse6 | stateresponse7 | sources | start_date | end_date | duration |
|---|---|---|---|---|---|---|---|---|---|---|---|---|---|---|---|---|---|---|---|---|---|---|---|---|---|---|---|---|---|---|---|---|
| i64 | str | i64 | i64 | str | i64 | i64 | i64 | i64 | i64 | i64 | i64 | i64 | i64 | str | str | str | str | str | str | str | str | str | str | str | str | str | str | str | str | date | date | duration[ms] |
| 201998000 | "Canada" | 20 | 1998 | "North America" | 0 | 0 | null | null | null | null | null | null | null | null | null | null | null | null | null | null | null | null | null | null | null | null | null | null | null | null | null | null |
| 201999000 | "Canada" | 20 | 1999 | "North America" | 0 | 0 | null | null | null | null | null | null | null | null | null | null | null | null | null | null | null | null | null | null | null | null | null | null | null | null | null | null |
| 202001000 | "Canada" | 20 | 2001 | "North America" | 0 | 0 | null | null | null | null | null | null | null | null | null | null | null | null | null | null | null | null | null | null | null | null | null | null | null | null | null | null |
| 202002000 | "Canada" | 20 | 2002 | "North America" | 0 | 0 | null | null | null | null | null | null | null | null | null | null | null | null | null | null | null | null | null | null | null | null | null | null | null | null | null | null |
| 202004000 | "Canada" | 20 | 2004 | "North America" | 0 | 0 | null | null | null | null | null | null | null | null | null | null | null | null | null | null | null | null | null | null | null | null | null | null | null | null | null | null |
Oops, that gives us only rows with a null duration, let’s put them last!
protests.sort(by='duration', descending=True, nulls_last=True).head()
| id | country | ccode | year | region | protest | protestnumber | startday | startmonth | startyear | endday | endmonth | endyear | protesterviolence | location | participants_category | participants | protesteridentity | protesterdemand1 | protesterdemand2 | protesterdemand3 | protesterdemand4 | stateresponse1 | stateresponse2 | stateresponse3 | stateresponse4 | stateresponse5 | stateresponse6 | stateresponse7 | sources | start_date | end_date | duration |
|---|---|---|---|---|---|---|---|---|---|---|---|---|---|---|---|---|---|---|---|---|---|---|---|---|---|---|---|---|---|---|---|---|
| i64 | str | i64 | i64 | str | i64 | i64 | i64 | i64 | i64 | i64 | i64 | i64 | i64 | str | str | str | str | str | str | str | str | str | str | str | str | str | str | str | str | date | date | duration[ms] |
| 6002011005 | "Morocco" | 600 | 2011 | "MENA" | 1 | 5 | 1 | 7 | 2011 | 24 | 1 | 2014 | 0 | "Imider" | "50-99" | ">50" | "protesters, students, locals, … | "political behavior, process" | "price increases, tax policy" | null | null | "killings" | null | null | null | null | null | null | "on moroccan hill, villagers ma… | 2011-07-01 | 2014-01-24 | 939d |
| 7502014011 | "India" | 750 | 2014 | "Asia" | 1 | 11 | 3 | 6 | 2014 | 3 | 6 | 2016 | 1 | "Jawahar Bagh, a public garden … | "2000-4999" | "About 2,000 people" | "a group that was calling for h… | "political behavior, process" | "price increases, tax policy" | null | null | "crowd dispersal" | "killings" | "shootings" | null | null | null | null | "24 killed as armed protesters … | 2014-06-03 | 2016-06-03 | 732d |
| 3502013013 | "Greece" | 350 | 2013 | "Europe" | 1 | 13 | 22 | 7 | 2013 | 11 | 5 | 2015 | 0 | "Athens" | "100-999" | "100s" | "state paid cleaning ladies" | "labor wage dispute" | null | null | null | "accomodation" | null | null | null | null | null | "." | "germany urges greece to vote o… | 2013-07-22 | 2015-05-11 | 659d |
| 6522011003 | "Syria" | 652 | 2011 | "MENA" | 1 | 3 | 18 | 3 | 2011 | 3 | 12 | 2012 | 1 | "National" | null | "10000s " | null | "political behavior, process" | "removal of politician" | "police brutality" | null | "killings" | "shootings" | "beatings" | "crowd dispersal" | "arrests" | "accomodation" | null | "security forces restrained as … | 2011-03-18 | 2012-12-03 | 627d |
| 1552016001 | "Chile" | 155 | 2016 | "South America" | 1 | 1 | 15 | 5 | 2016 | 17 | 5 | 2017 | 0 | "Chiloe Island" | "50-99" | ">50" | "fishermen" | "political behavior, process" | null | null | null | "ignore" | null | null | null | null | null | null | "1. toxic red tide in chile pro… | 2016-05-15 | 2017-05-17 | 368d |
Exercise - Longest Italian protests#
✪ Analyze data from protests to find the 5 longest protests in Italy:
Show code cell source
# The two following ways are equivalent, the first might save you a few keystrokes.
protests.filter(pl.col("country") == "Italy").sort(by="duration").tail().reverse()

protests.filter(pl.col("country") == "Italy").sort(
    by="duration", descending=True, nulls_last=True
).head()
| id | country | ccode | year | region | protest | protestnumber | startday | startmonth | startyear | endday | endmonth | endyear | protesterviolence | location | participants_category | participants | protesteridentity | protesterdemand1 | protesterdemand2 | protesterdemand3 | protesterdemand4 | stateresponse1 | stateresponse2 | stateresponse3 | stateresponse4 | stateresponse5 | stateresponse6 | stateresponse7 | sources | start_date | end_date | duration |
|---|---|---|---|---|---|---|---|---|---|---|---|---|---|---|---|---|---|---|---|---|---|---|---|---|---|---|---|---|---|---|---|---|
| i64 | str | i64 | i64 | str | i64 | i64 | i64 | i64 | i64 | i64 | i64 | i64 | i64 | str | str | str | str | str | str | str | str | str | str | str | str | str | str | str | str | date | date | duration[ms] |
| 3252002008 | "Italy" | 325 | 2002 | "Europe" | 1 | 8 | 20 | 5 | 2002 | 20 | 7 | 2002 | 0 | "Sicily" | "100-999" | "100s" | "peasants, farmers" | "land farm issue" | null | null | null | "crowd dispersal" | "arrests" | "accomodation" | null | null | null | null | "mafia sells water in a land hi… | 2002-05-20 | 2002-07-20 | 62d |
| 3252010003 | "Italy" | 325 | 2010 | "Europe" | 1 | 3 | 2 | 9 | 2010 | 23 | 10 | 2010 | 1 | "Terzigno and Boscotrecase" | "100-999" | "100s" | "residents" | "land farm issue" | "political behavior, process" | null | null | "crowd dispersal" | "arrests" | "accomodation" | null | null | null | null | "1 why italy s trash wars are s… | 2010-09-02 | 2010-10-23 | 52d |
| 3252017001 | "Italy" | 325 | 2017 | "Europe" | 1 | 1 | 24 | 3 | 2017 | 6 | 4 | 2017 | 0 | "Rome" | "100-999" | "100" | "residents" | "land farm issue" | null | null | null | "accomodation" | null | null | null | null | null | null | "new bulbs turn romans into zom… | 2017-03-24 | 2017-04-06 | 14d |
| 3252018001 | "Italy" | 325 | 2018 | "Europe" | 1 | 1 | 1 | 1 | 2018 | 9 | 1 | 2018 | 0 | "national" | "100-999" | "100" | "protesters" | "social restrictions" | null | null | null | "ignore" | null | null | null | null | null | null | "biodegradable bags cause outra… | 2018-01-01 | 2018-01-09 | 9d |
| 3252017006 | "Italy" | 325 | 2017 | "Europe" | 1 | 6 | 15 | 7 | 2017 | 22 | 7 | 2017 | 0 | "Sicily" | "50-99" | "50" | "five star movement" | "land farm issue" | null | null | null | "ignore" | null | null | null | null | null | null | "italian town loses patience wi… | 2017-07-15 | 2017-07-22 | 8d |
Operations on strings#
To perform operations on string columns, we need to use the .str accessor after selecting the right column. This gives you access to a number of methods, some similar to known Python method to manipulate strings, some not. For more details, head over to the documentation.
Filter by textual values#
When we want to filter by text values, we can use .str.contains, here for example we select all the protests in which the source article mentioned a “riot”:
protests.filter(pl.col("sources").str.contains("riot")).head()
| id | country | ccode | year | region | protest | protestnumber | startday | startmonth | startyear | endday | endmonth | endyear | protesterviolence | location | participants_category | participants | protesteridentity | protesterdemand1 | protesterdemand2 | protesterdemand3 | protesterdemand4 | stateresponse1 | stateresponse2 | stateresponse3 | stateresponse4 | stateresponse5 | stateresponse6 | stateresponse7 | sources | start_date | end_date | duration |
|---|---|---|---|---|---|---|---|---|---|---|---|---|---|---|---|---|---|---|---|---|---|---|---|---|---|---|---|---|---|---|---|---|
| i64 | str | i64 | i64 | str | i64 | i64 | i64 | i64 | i64 | i64 | i64 | i64 | i64 | str | str | str | str | str | str | str | str | str | str | str | str | str | str | str | str | date | date | duration[ms] |
| 201992001 | "Canada" | 20 | 1992 | "North America" | 1 | 1 | 4 | 5 | 1992 | 5 | 5 | 1992 | 1 | "Toronto" | null | "1000" | "gangs of black and white youth… | "police brutality" | null | null | null | "arrests" | null | null | null | null | null | null | "1. window smashing and looting… | 1992-05-04 | 1992-05-05 | 2d |
| 202008001 | "Canada" | 20 | 2008 | "North America" | 1 | 1 | 10 | 8 | 2008 | 10 | 8 | 2008 | 1 | "Montreal, Quebec" | null | "100s" | "unspecified" | "police brutality" | null | null | null | "crowd dispersal" | null | null | null | null | null | null | "1. canada: rioting in montreal… | 2008-08-10 | 2008-08-10 | 1d |
| 202012001 | "Canada" | 20 | 2012 | "North America" | 1 | 1 | 10 | 2 | 2012 | 6 | 6 | 2012 | 1 | "Quebec" | null | "1000s" | "university students" | "price increases, tax policy" | null | null | null | "crowd dispersal" | "arrests" | null | null | null | null | null | "1. quebec plans to suspend cla… | 2012-02-10 | 2012-06-06 | 118d |
| 401994001 | "Cuba" | 40 | 1994 | "North America" | 1 | 1 | 5 | 8 | 1994 | 5 | 8 | 1994 | 1 | "Havana" | null | "1000" | "unspecified" | "political behavior, process" | null | null | null | "arrests" | null | null | null | null | null | null | "1. protesters battle police in… | 1994-08-05 | 1994-08-05 | 1d |
| 411995002 | "Haiti" | 41 | 1995 | "North America" | 1 | 2 | 23 | 11 | 1995 | 23 | 11 | 1995 | 1 | "Cite Soleil" | null | "50" | "residents of cite soleil" | "police brutality" | null | null | null | "ignore" | null | null | null | null | null | null | "1. fatal clashes in haiti slum… | 1995-11-23 | 1995-11-23 | 1d |
Extracting strings#
We can also use it, for instance, to extract a rough estimate of the number of participants as an integer, as follows:
protests.with_columns(pl.col('participants').str.extract("([0-9]+)").cast(int)).head()
| id | country | ccode | year | region | protest | protestnumber | startday | startmonth | startyear | endday | endmonth | endyear | protesterviolence | location | participants_category | participants | protesteridentity | protesterdemand1 | protesterdemand2 | protesterdemand3 | protesterdemand4 | stateresponse1 | stateresponse2 | stateresponse3 | stateresponse4 | stateresponse5 | stateresponse6 | stateresponse7 | sources | start_date | end_date | duration |
|---|---|---|---|---|---|---|---|---|---|---|---|---|---|---|---|---|---|---|---|---|---|---|---|---|---|---|---|---|---|---|---|---|
| i64 | str | i64 | i64 | str | i64 | i64 | i64 | i64 | i64 | i64 | i64 | i64 | i64 | str | str | i64 | str | str | str | str | str | str | str | str | str | str | str | str | str | date | date | duration[ms] |
| 201990001 | "Canada" | 20 | 1990 | "North America" | 1 | 1 | 15 | 1 | 1990 | 15 | 1 | 1990 | 0 | "national" | null | 1000 | "unspecified" | "political behavior, process" | "labor wage dispute" | null | null | "ignore" | null | null | null | null | null | null | "1. great canadian train journe… | 1990-01-15 | 1990-01-15 | 1d |
| 201990002 | "Canada" | 20 | 1990 | "North America" | 1 | 2 | 25 | 6 | 1990 | 25 | 6 | 1990 | 0 | "Montreal, Quebec" | null | 1000 | "unspecified" | "political behavior, process" | null | null | null | "ignore" | null | null | null | null | null | null | "1. autonomy s cry revived in q… | 1990-06-25 | 1990-06-25 | 1d |
| 201990003 | "Canada" | 20 | 1990 | "North America" | 1 | 3 | 1 | 7 | 1990 | 1 | 7 | 1990 | 0 | "Montreal, Quebec" | null | 500 | "separatist parti quebecois" | "political behavior, process" | null | null | null | "ignore" | null | null | null | null | null | null | "1. quebec protest after queen … | 1990-07-01 | 1990-07-01 | 1d |
| 201990004 | "Canada" | 20 | 1990 | "North America" | 1 | 4 | 12 | 7 | 1990 | 6 | 9 | 1990 | 1 | "Montreal, Quebec" | null | 100 | "mohawk indians" | "land farm issue" | null | null | null | "accomodation" | null | null | null | null | null | null | "1. indians gather as siege int… | 1990-07-12 | 1990-09-06 | 57d |
| 201990005 | "Canada" | 20 | 1990 | "North America" | 1 | 5 | 14 | 8 | 1990 | 15 | 8 | 1990 | 1 | "Montreal, Quebec" | null | 950 | "local residents" | "political behavior, process" | null | null | null | "crowd dispersal" | "arrests" | "accomodation" | null | null | null | null | "1. dozens hurt in mohawk block… | 1990-08-14 | 1990-08-15 | 2d |
Note
"([0-9]+)" is a regular expression. A whole course could be dedicated to them, so for now, you should just know that this particular one extracts any sequence of integers from a string. They are a very practical tool, so I wanted to make you aware of their existence, but you don’t need to know more than that for this course.
Note
There is a bunch of other data types with a special accessor, but we won’t cover them here.
Exercise - Game of Thrones#
Open with Polars the file game-of-thrones.csv which holds episodes from various years.
IMPORTANT: place the dataframe into the variable
game, so not to confuse it with previous dataframes
Data source: Kaggle - License: CC0: Public Domain
Show code cell source
game = pl.read_csv('data/game-of-thrones.csv')
Favorite episodes#
You are given a dictionary favorite with the most liked episodes of a group of people, who unfortunately don’t remember exactly the various titles which are often incomplete: Select the favorite episodes of Paolo and Chiara.
assume the capitalization in
favoriteis the correct oneNOTE: the dataset contains insidious double quotes around the titles, but if you write the code in the right way it shouldn’t be a problem
favorite = {
    "Paolo": "Winter Is",
    "Chiara": "Wolf and the Lion",
    "Anselmo": "Fire and",
    "Letizia": "Garden of",
}
Show code cell source
fav_episodes = game.filter(
    pl.col("Title").str.contains(favorite["Paolo"])
    | pl.col("Title").str.contains(favorite["Chiara"])
)
fav_episodes
| No. overall | No. in season | Season | Title | Directed by | Written by | Novel(s) adapted | Original air date | U.S. viewers(millions) | Imdb rating |
|---|---|---|---|---|---|---|---|---|---|
| i64 | i64 | i64 | str | str | str | str | str | f64 | f64 |
| 1 | 1 | 1 | ""Winter Is Coming"" | "Tim Van Patten" | "David Benioff & D. B. Weiss" | "A Game of Thrones" | "17-Apr-11" | 2.22 | 9.1 |
| 5 | 5 | 1 | ""The Wolf and the Lion"" | "Brian Kirk" | "David Benioff & D. B. Weiss" | "A Game of Thrones" | "15-May-11" | 2.58 | 9.1 |
First airing#
Write a function first_aired that returns a dataframe containing all the episodes which have been aired the first time in a given year (Original air date column)
NOTE:
yearis given as anint
Show code cell source
def first_aired(df, year):
    return df.filter(pl.col("Original air date").str.slice(-2) == str(year)[2:])
first_aired(game, 2017)
| No. overall | No. in season | Season | Title | Directed by | Written by | Novel(s) adapted | Original air date | U.S. viewers(millions) | Imdb rating |
|---|---|---|---|---|---|---|---|---|---|
| i64 | i64 | i64 | str | str | str | str | str | f64 | f64 |
| 62 | 2 | 7 | ""Stormborn"" | "Mark Mylod" | "Bryan Cogman" | "Outline from A Dream of Spring… | "23-Jul-17" | 9.27 | 8.9 |
| 63 | 3 | 7 | ""The Queen's Justice"" | "Mark Mylod" | "David Benioff & D. B. Weiss" | "Outline from A Dream of Spring… | "30-Jul-17" | 9.25 | 9.2 |
| 64 | 4 | 7 | ""The Spoils of War"" | "Matt Shakman" | "David Benioff & D. B. Weiss" | "Outline from A Dream of Spring… | "6-Aug-17" | 10.17 | 9.8 |
| 65 | 5 | 7 | ""Eastwatch"" | "Matt Shakman" | "Dave Hill" | "Outline from A Dream of Spring… | "13-Aug-17" | 10.72 | 8.8 |
| 66 | 6 | 7 | ""Beyond the Wall"" | "Alan Taylor" | "David Benioff & D. B. Weiss" | "Outline from A Dream of Spring… | "20-Aug-17" | 10.24 | 9.0 |
| 67 | 7 | 7 | ""The Dragon and the Wolf"" | "Jeremy Podeswa" | "David Benioff & D. B. Weiss" | "Outline from A Dream of Spring… | "27-Aug-17" | 12.07 | 9.4 |
A parallel with spreadsheets#
You’re probably familiar with some spreadsheets software, such as Excel or Google Sheets. To make an analogy, you can picture a dataframe as a single sheet, which in Python is stored as a variable. Then, if you do not reassign this variable, the dataframe stays the same – so in the analogy, the sheet is untouched. So while in a spreadsheet, you’d compute for instance the sum of a column in a cell on the same sheet, in Python, you’d assign the result of the sum to a new variable, that is, to a new sheet. Same goes for filtering or reordering the rows: if you do not explicitly override the original variable, the original data stays intact.