Page Not Found
Page not found. Your pixels are in another canvas.

A list of all the posts and pages found on the site. For you robots out there is an XML version available for digesting as well.
Page not found. Your pixels are in another canvas.
About me
Published:
This is a sample blog post. Lorem ipsum I can’t remember the rest of lorem ipsum and don’t have an internet connection right now. Testing testing testing this blog post. Blog posts are cool.
The main purpose of this research is to assess the impact of aircraft noise around an airport considering spatial and temporal variations in the population. The concept of dynamic airport noise mapping has been demonstrated on Ljubljana airport case study. Detailed population mobility information for Slovenia were retrieved from a survey. The hourly noise contour levels generated by the airport’s departure and arrival operations were calculated, and the annoyed population was thus estimated considering a reference scenario, where only the residential area was taken into account, and also a dynamic one, in which the population’s mobility was included. The results show that for the dynamic scenario, the total number of people annoyed by noise increases by 2.9%, while the number of highly annoyed people decreases by 10% compared to the reference scenario. On the individual level, there are many cases of both overestimating and underestimating the noise impact. Since so far the standard in airport noise mapping has been to use census data, we have shown the importance of including explicit population mobility in noise impact calculations.
Ganić, E., van Oosten, N., Meliveo, L., Jeram, S., Louf, T., Ramasco, J.J. (2020). Dynamic noise maps for Ljubljana airport. 10th SESAR Innovation Days. <a href=https://doi.org/10.5281/zenodo.5517304>doi:10.5281/zenodo.5517304</a> https://doi.org/10.5281/zenodo.5517304
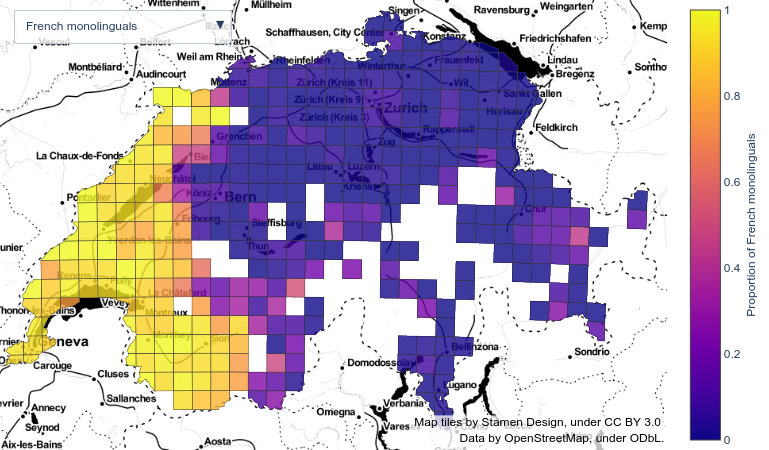
Cultural diversity encoded within languages of the world is at risk, as many languages have become endangered in the last decades in a context of growing globalization. To preserve this diversity, it is first necessary to understand what drives language extinction, and which mechanisms might enable coexistence. Here, we study language shift mechanisms using theoretical and data-driven perspectives. A large-scale empirical analysis of multilingual societies using Twitter and census data yields a wide diversity of spatial patterns of language coexistence. It ranges from a mixing of language speakers to segregation with multilinguals on the boundaries of disjoint linguistic domains. To understand how these different states can emerge and, especially, become stable, we propose a model in which language coexistence is reached when learning the other language is facilitated and when bilinguals favor the use of the endangered language. Simulations carried out in a metapopulation framework highlight the importance of spatial interactions arising from people mobility to explain the stability of a mixed state or the presence of a boundary between two linguistic regions. Further, we find that the history of languages is critical to understand their present state.
Louf, T., Sánchez, D., Ramasco, J.J. (2021). Capturing the diversity of multilingual societies. Physical Review Research, 3(4), 043146. <a href=https://doi.org/10.1103/PhysRevResearch.3.043146>doi:10.1103/PhysRevResearch.3.043146</a> https://doi.org/10.1103/PhysRevResearch.3.043146
Cultural areas represent a useful concept that cross-fertilizes diverse fields in social sciences. Knowledge of how humans organize and relate their ideas and behavior within a society can help us to understand our actions and attitudes toward different issues. However, the selection of common traits that shape a cultural area is somewhat arbitrary. What is needed is a method that can leverage the massive amounts of data coming online, especially through social media, to identify cultural regions without ad-hoc assumptions, biases, or prejudices. This work takes a crucial step in this direction by introducing a method to infer cultural regions based on the automatic analysis of large datasets from microblogging posts. The approach presented here is based on the principle that cultural affiliation can be inferred from the topics that people discuss among themselves. Specifically, regional variations in written discourse are measured in American social media. From the frequency distributions of content words in geotagged tweets, the regional hotspots of words’ usage are found, and from there, principal components of regional variation are derived. Through a hierarchical clustering of the data in this lower-dimensional space, this method yields clear cultural areas and the topics of discussion that define them. It uncovers a manifest North–South separation, which is primarily influenced by the African American culture, and further contiguous (East–West) and non-contiguous divisions that provide a comprehensive picture of modern American cultural areas.
Louf, T., Gonçalves, B., Ramasco, J.J., Sánchez, D., Grieve, J. (2023). American cultural regions mapped through the lexical analysis of social media. Humanities and Social Sciences Communications, 10(1), 1–11. <a href=https://doi.org/10.1057/s41599-023-01611-3>doi:10.1057/s41599-023-01611-3</a> https://doi.org/10.1057/s41599-023-01611-3
Louf, T., Sánchez, D., MiguelFranco, R. (2023, in press). Algoritmos de agrupamiento y lingüística de corpus: ortografía y léxico en documentos mallorquines del siglo xviii. Scripta manent. Diacronía del español, documentación archivística y Humanidades digitales. Peter Lang.
Baqir, A., Chen, Y., Diaz-Diaz, F., Kiyak, S., Louf, T., Morini, V., … Galeazzi, A. (2025). Unveiling the drivers of active participation in social media discourse. Scientific Reports, 15(1), 4906. <a href=https://doi.org/10.1038/s41598-025-88117-x>doi:10.1038/s41598-025-88117-x</a> https://doi.org/10.1038/s41598-025-88117-x
Louf, T., Ramasco, J.J., Sánchez, D., Karsai, M. (2025). When dialects collide: how socioeconomic mixing affects language use. EPJ Data Science, 14(1), 1–21. <a href=https://doi.org/10.1140/epjds/s13688-025-00563-9>doi:10.1140/epjds/s13688-025-00563-9</a> https://doi.org/10.1140/epjds/s13688-025-00563-9
, Master in Big Data Analytics, 1900
, Data Science Summer School, University of Trento, 1900